Why Fragmented Broker Dashboards Mislead Investors Before You Consolidate
If you invest across multiple brokers, fragmented dashboards can distort returns, fee visibility, and allocation decisions. This awareness page explains the problem; the multi-broker consolidation guide owns the workflow.
Posted by
Related reading
Broker Fee Comparison for European ETF Investors: 5 Real Scenarios
Compare broker fees for European ETF investing with 5 real scenarios, then route your decision into the live comparison tool and fee-drag calculator.
Best Way to Track an ETF Portfolio Across Brokers (2026)
Looking for the best way to track an ETF portfolio across brokers? Use a workflow that captures real returns, dividends, fees, and FX drag instead of dashboard noise.
Best Portfolio Tracker Europe 2026: Getquin, DEGIRO & Multi-Broker
Compare portfolio trackers for European investors using Getquin, DEGIRO, IBKR, and multiple brokers, with a quick verdict for consolidated reporting and fee visibility.
Why fragmented portfolio views create false confidence
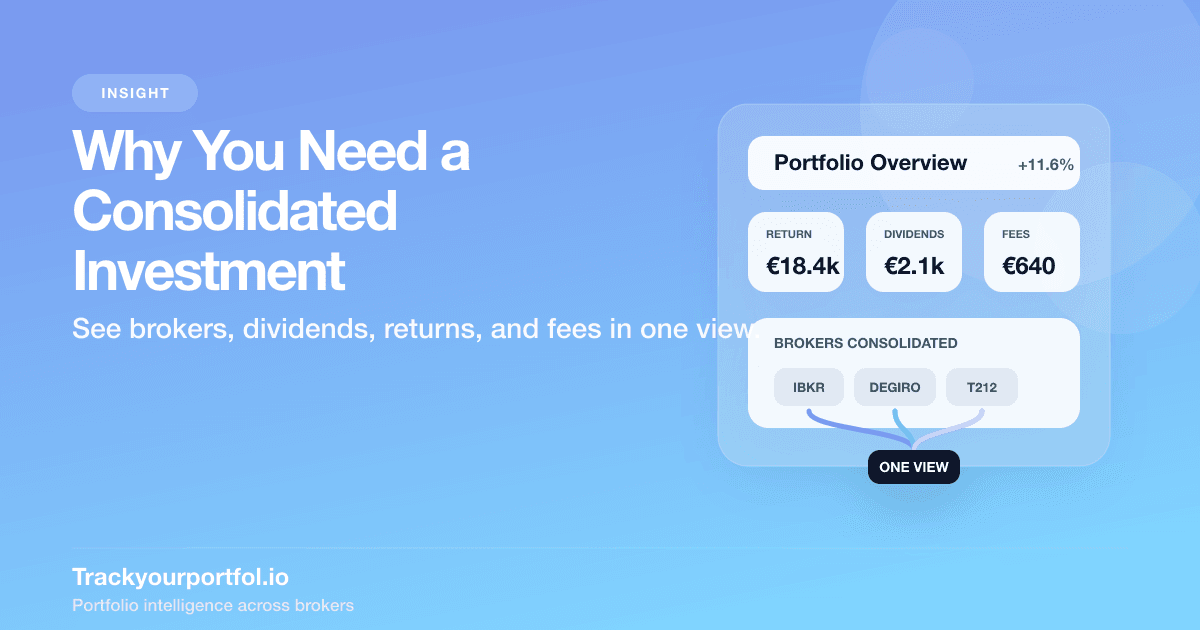
Most serious retail investors do not stay with one broker forever. A bank account becomes a DEGIRO account, then an IBKR account gets added for broader market access, and eventually the portfolio lives across several dashboards that were never designed to work together.
That fragmentation creates a subtle but expensive problem: every broker view feels complete when it is only showing one slice of the truth. You can feel informed while still missing your actual total return, your real allocation, or the cost drag created by your full setup.
This page is not the how-to workflow for fixing that problem. It is the awareness piece: why fragmented broker dashboards mislead investors in the first place, and why relying on them for portfolio decisions is riskier than it looks. If you already want the step-by-step process, skip to the multi-broker portfolio tracking workflow.
Use this page for the diagnosis, not the workflow
- Reading this page: you are still diagnosing why separate broker dashboards create blind spots.
- Need the actual workflow? Go to Track a portfolio across multiple brokers.
- Already ready for a tool? Start with the portfolio preview or Trackyourportfol.io.
Where broker dashboards break down first
The failure is usually not the individual dashboard. It is the gap between dashboards. Each broker reports performance, costs, cash, and dividends through its own logic, which means your mental model can go wrong even if every single broker screen is technically correct.
- Returns are shown per account, not for the portfolio you actually own across all brokers.
- FX conversion costs, custody charges, and spread drag are rarely visible in one decision-grade view.
- Dividend income looks cleaner than it is when withholding tax and broker-level friction are split across statements.
- Asset allocation can appear balanced per broker while the combined portfolio is unintentionally concentrated.
In other words, fragmented dashboards do not just hide information. They can actively encourage bad interpretation.
The real risk is decision error, not reporting inconvenience
Investors usually describe this as a tracking annoyance. That understates the problem. The deeper issue is decision error: changing brokers, rebalancing, adding capital, or evaluating strategy based on incomplete numbers.
A fragmented setup makes it harder to answer the questions that actually matter:
- What did my full portfolio really return after fees?
- Am I duplicating exposure across brokers without noticing?
- Is one broker genuinely cheaper, or does it only look cheaper on headline fees?
- Are my dividends and cash flows being measured consistently enough to trust the result?
Once the problem is framed this way, the next step becomes clearer: you do not just need another dashboard. You need a portfolio-level workflow.
Where to go when you are ready to fix it
If this problem sounds familiar, the right next read is our guide to consolidating and tracking a portfolio across multiple brokers. That page owns the practical workflow and tool-selection job: exports, normalization, portfolio-level review, and how to choose between a spreadsheet, broker dashboards, or a dedicated tracker.
This page stays one level earlier in the journey. It is the awareness piece for investors who still need to understand why separate broker dashboards create blind spots before they choose a workflow. If the main issue you discover is cost drag rather than data sprawl, use the hidden investment fees calculator. If you first need to separate dashboard noise from actual investor outcomes, read our guide to calculating real portfolio returns after fees. If the main issue is broker selection, compare likely cost stacks with compare broker fees. If you want to evaluate dedicated tracking tools instead of relying on individual broker views, see our best portfolio tracker for Europe comparison.
Put differently: this article should explain why the dashboards feel incomplete. The consolidation guide should do the actual multi-broker portfolio tracking job.
Why we care about this problem
We built trackyourportfolio because this is how serious retail investing looks in real life: multiple brokers, multiple currencies, multiple statements, and too many partial truths. Investors do not need more noise. They need one trustworthy picture of the portfolio they actually own.