Trading 212 Commission Fees 2026: FX Costs, ETFs, and Real Drag
See the 2026 verdict on Trading 212 commission fees, the 0.15% FX fee, ETF costs, spreads, and when to compare brokers or calculate annual drag.
Posted by
Related reading
Weekly Portfolio Review Checklist for Multi-Broker Investors
A practical weekly portfolio review checklist for investors with multiple brokers, currencies, dividends, fees, and recurring contributions to track.
Broker Fee Comparison for European ETF Investors: 5 Real Scenarios
Compare broker fees for European ETF investing with 5 real scenarios, then route your decision into the live comparison tool and fee-drag calculator.
Best Way to Track an ETF Portfolio Across Brokers (2026)
Looking for the best way to track an ETF portfolio across brokers? Use a workflow that captures real returns, dividends, fees, and FX drag instead of dashboard noise.
Trading 212 Commission Fees 2026: The Fast Verdict
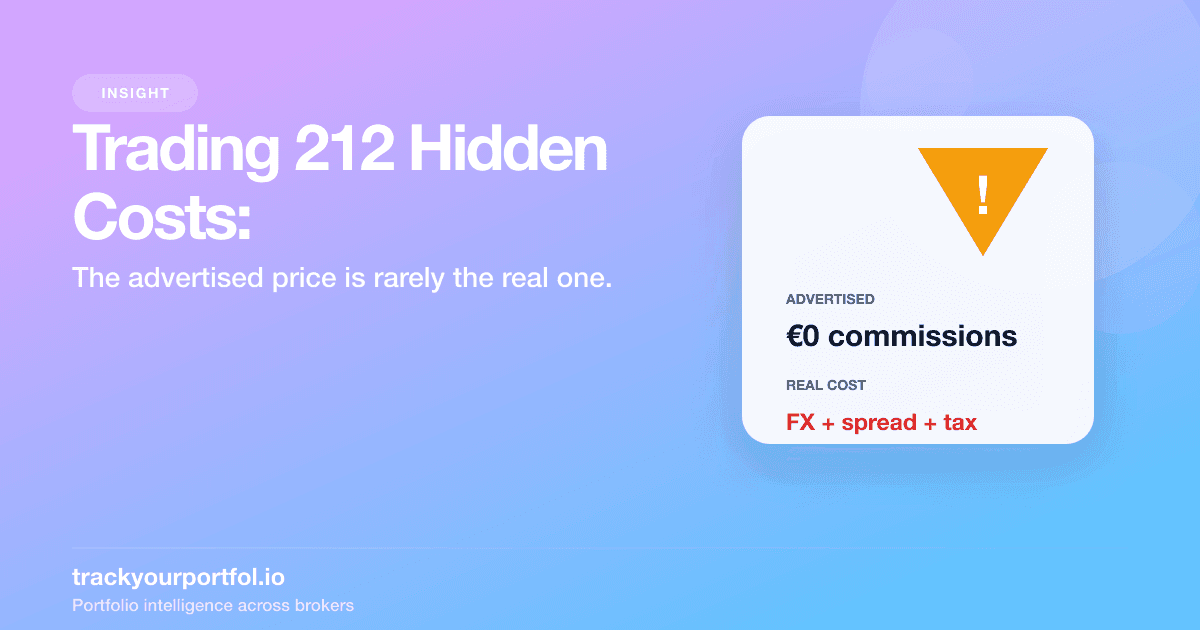
Trading 212 can be cheap for long-term investors because stock and ETF commissions on the Invest account can be 0. The mistake is treating that as the whole cost answer. In 2026, the real annual drag to check is usually the 0.15% FX fee on currency conversions, plus spreads, stamp duty on some markets, and the economics of idle cash and share lending.
The practical verdict is simple. If you buy EUR-denominated ETFs from a EUR cash balance and rarely trade, Trading 212 can stay genuinely cheap. If you regularly buy US stocks or ETFs from EUR or GBP cash, the 0.15% FX fee becomes the first hidden cost to audit because it can apply on both entry and exit and compound faster than most people expect.
Use this page in one of two ways: if you want to compare Trading 212 against another broker before switching, go straight to compare broker fees. If you already use Trading 212 and want to estimate your own annual drag, run the numbers through the hidden investment fees calculator.
| Investor setup | Trading 212 usually cheap? | What decides it | Best next step |
|---|---|---|---|
| Buy-and-hold ETF investor using the account's main currency | Usually yes | Zero commissions matter more because FX friction stays low. | Use the hidden investment fees calculator if you want to turn the low-cost story into a real annual number. |
| EUR or GBP investor regularly buying USD stocks or ETFs | Only sometimes | The 0.15% FX fee becomes the main recurring drag and compounds on both entry and exit. | Start with compare broker fees, then quantify the drag with the calculator if you keep the account. |
| Frequent trader in smaller names, niche ETFs, or off-hours markets | Depends | Spreads and repeated execution friction matter more than the zero-commission headline. | Compare likely broker costs first instead of assuming the headline price wins. |
For most European investors, the real decision tree is simple: compare brokers if you are choosing where to invest next, and calculate annual drag if you are deciding whether your current Trading 212 setup is still efficient. A zero-commission ETF order can still be the right choice, but only after you know whether FX and spread costs are small in your actual workflow.
Which Trading 212 Fees Matter Most in Practice?
Most searchers asking about Trading 212 commission fees in 2026 do not need six categories weighted equally. They need to know which costs are worth checking first before they assume Trading 212 is either free or expensive.
- Usually the biggest cost: FX conversion when your portfolio currency and trading currency do not match.
- Usually the second hidden cost: spread, especially on smaller names, niche ETFs, or trades placed outside the main market session.
- Usually unavoidable: market taxes like UK stamp duty or French and Italian transaction taxes.
- Usually niche or situational: CFD overnight financing, the opportunity cost of idle cash, and the risk/reward trade-off of share lending.
That ranking matters because it changes what you should audit first. A buy-and-hold ETF investor who trades in the account's base currency can ignore most noise and focus on spread quality. A cross-currency investor should start with FX before looking at anything else.
FX Conversion: The Biggest Hidden Cost for European Investors
For most European investors buying US stocks or global ETFs, currency conversion is the single largest ongoing cost on Trading 212. The standard FX fee is 0.15% of the transaction value, applied each way. That means a round trip (buy and later sell) costs 0.30% in FX alone.
On a 10,000 EUR portfolio that turns over once per year in USD-denominated assets, that is roughly 30 EUR per year in FX drag. For a 50,000 EUR portfolio with moderate trading, the annual FX cost can easily reach 150 EUR or more.
The key issue is not whether the commission is zero. It is whether your investing workflow repeatedly forces small cross-currency conversions. If you regularly buy USD-denominated assets from EUR or GBP cash, the 0.15% FX charge can become the clearest recurring drag in the whole Trading 212 cost stack.
The practical step is to audit how often you trigger FX rather than assume it is negligible. Check your transaction history, estimate how much repeated conversions have cost over the past year, and compare that drag with the rest of your broker costs. If you want to understand how FX friction interacts with investment performance, our guide to tracking portfolio performance across multiple currencies explains how to separate market returns from currency translation effects.
Spread Costs: Real Money You Never See Deducted
The bid-ask spread is the gap between the price at which you can buy and the price at which you can sell at any given moment. It is a real cost of every trade, but Trading 212 never shows it as a separate fee. It is simply baked into your execution price.
For highly liquid instruments like Apple, Microsoft, or popular ETFs like VWCE, the spread is typically tiny — often less than 0.01%. But for smaller-cap European stocks, less traded ETFs, or instruments during off-hours, spreads can widen to 0.1% to 0.5% or more.
Trading 212 routes orders through market makers, and the execution quality you receive depends on the liquidity of the instrument and the time of day you trade. Trading during the main session of the relevant exchange (for example, US market hours for US stocks) consistently produces tighter spreads.
A useful habit: before placing an order, check the live bid and ask prices. If the spread looks unusually wide, consider using a limit order instead of a market order to control your entry price.
Securities Lending: How Trading 212 Monetizes Your Holdings
Trading 212 operates a Share Lending program where your shares can be lent to institutional borrowers (typically short sellers). In return, Trading 212 earns lending fees and shares a portion of that revenue with you.
The lending split has historically been approximately 50/50 between Trading 212 and the account holder, though the exact terms are detailed in the Share Lending Agreement. The income you receive appears as Interest on your account statement.
For most retail portfolios holding mainstream stocks and ETFs, securities lending income is modest — often a few euros per year on a typical portfolio. The real question is not the income but the counterparty risk: while your shares are on loan, they are held by the borrower rather than in your custody, protected by collateral posted to Trading 212.
You can opt out of the Share Lending program in your account settings. The trade-off is straightforward: opt out and you eliminate lending counterparty risk but lose the small income stream. Most investors with portfolios under 50,000 EUR will barely notice the difference either way.
Stamp Duty and Financial Transaction Taxes: The Costs You Cannot Avoid
Several European governments impose transaction taxes on share purchases, and Trading 212 passes these through automatically. These are not broker fees — they are government-mandated costs that apply regardless of which platform you use.
- UK Stamp Duty Reserve Tax (SDRT): 0.5% on purchases of UK-listed shares. Buy 1,000 GBP of a London-listed stock, and 5 GBP goes to HMRC automatically.
- French Financial Transaction Tax (FTT): 0.3% on purchases of qualifying French shares with a market capitalization above 1 billion EUR. Applies to most large French companies like LVMH, TotalEnergies, and BNP Paribas.
- Italian Financial Transaction Tax: 0.1% on purchases of qualifying Italian shares listed on regulated markets, and 0.2% for OTC transactions.
- Irish Stamp Duty: 1% on purchases of Irish-domiciled shares.
How to Calculate Your True Annual Cost on Trading 212
Here is a practical 15-minute workflow to estimate your total cost of ownership on Trading 212:
Step 1: Export your transaction history from the Trading 212 app. Go to your account settings and download the CSV statement covering the past 12 months.
Step 2: Sum all explicit charges — look for any FX conversion entries, stamp duty, and transaction tax line items in the export.
Step 3: Estimate your spread cost. For liquid instruments, assume 0.02% per trade. For less liquid instruments, assume 0.1%. Multiply by your total traded volume.
Step 4: Check your securities lending income. This offsets your costs slightly.
Step 5: Add up the totals and divide by your average portfolio value for the year. This gives you your all-in cost as a percentage — your true expense ratio for using Trading 212.
For a typical European investor with a 20,000 EUR portfolio buying primarily US ETFs, the all-in annual cost on Trading 212 usually falls between 0.15% and 0.40%, depending on trading frequency and currency exposure. That is genuinely competitive, but it is not zero. If you want to turn that estimate into your own number, run it through the hidden investment fees calculator before you assume commission-free means low-drag. Then use how broker fees affect returns to see what that drag can cost over longer holding periods.
What Trading 212 Does Not Show You in One Place
Trading 212 provides transaction history exports and basic performance charts, but it does not consolidate FX drag, spread impact, and tax costs into one investor-level cost number. You still have to reconstruct your true annual drag manually if you want a real total cost of ownership view.
This gap matters even more if you use multiple brokers. If some holdings sit on Trading 212, others on DEGIRO or Interactive Brokers, and maybe a pension or ISA elsewhere, no single broker tells you what the full portfolio costs to run. If that is your setup, the natural next read is our guide to tracking a portfolio across multiple brokers.
If your real question is not just “what are Trading 212's fees?” but “is Trading 212 cheaper than my alternatives for how I actually invest?”, go to compare broker fees. If the question is “how much drag did my current setup create last year?”, use the hidden investment fees calculator.
TrackYourPortfol.io fills that missing view by importing Trading 212 CSV data, combining it with other brokers when needed, and helping you inspect real returns, earned dividends, and fee drag without rebuilding the whole analysis in spreadsheets.
Trading 212 Fees 2026: The Bottom Line
Trading 212 deserves the low-cost label for many long-term ETF investors. It does not deserve the “free” label once FX, spreads, and transaction taxes are part of the real workflow.
If most of your investing is same-currency, low-turnover, and focused on liquid instruments, Trading 212 can remain genuinely competitive. If you trade across currencies, buy taxed markets, or want a true all-in cost number, you need to audit the full stack instead of stopping at the zero-commission headline.
That is the practical takeaway: compare the broker if you are deciding where to invest next, and calculate the annual drag if you are deciding whether your current setup is still efficient.